18 April 2024
The Continuous Mortality Investigation (CMI) has released the latest annual update to the CMI Mortality Projections Model, CMI_2023.
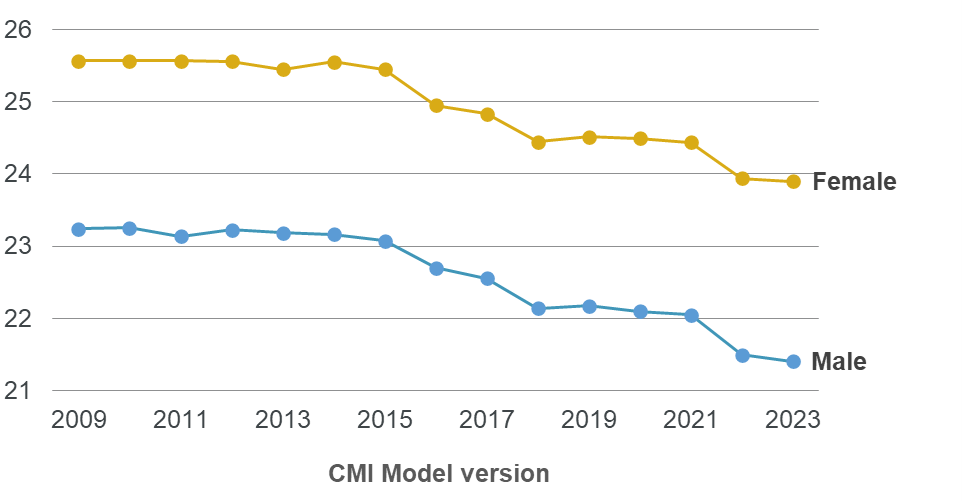
CMI_2023 produces cohort life expectancies at age 65 that are about 5 weeks lower for males and about 2 weeks lower for females than in the previous version of the CMI model, CMI_2022. These changes are much smaller than between CMI_2021 and CMI_2022.
The CMI Model is used by UK pension schemes and insurance companies which need to make assumptions about future mortality rates. While mortality experience in 2020 and 2021 will affect actuarial calculations, mortality in both of those years was exceptional and is unlikely to be indicative of future mortality. For this reason, the CMI places no weight on the data for 2020 and 2021 in the core version of the model.
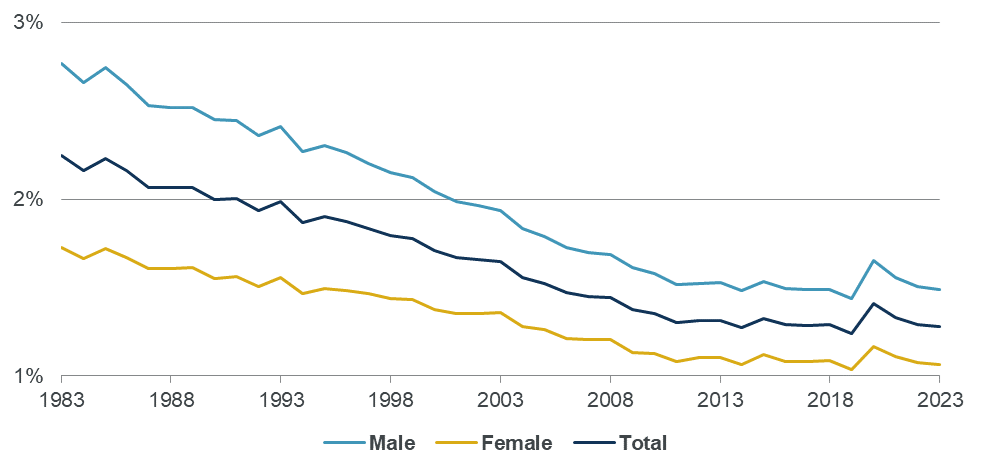
Standardised mortality rates in England & Wales have fallen each year since 2020. Mortality in 2023 was the third lowest on record and similar to the 2015-2019 average, but still above projections from versions of the CMI Model before the pandemic. Mortality in the first quarter of 2024 has also been relatively low, comparable to the start of 2019, which is still the lowest year on record.
Recent mortality is likely to be indicative of future mortality to some extent. Given that, and following consultation with users, the CMI has placed 15% weight on data for 2022 and 2023 when calibrating CMI_2023 while still placing no weight on data for 2020 and 2021.
As weights do not affect projections linearly, placing a 15% weight on data for 2022 and 2023 results in a projection that falls slightly closer to a projection that places full weight on these years than one that gives them no weight.
Cobus Daneel, Chair, CMI Mortality Projections Committee, said: “While recent mortality has been similar to the period immediately before the pandemic, the outlook for mortality remains uncertain. It is unclear whether there are just lingering short-term effects of the pandemic that will rapidly fade or whether the pandemic will have a fundamental impact on the longer-term mortality trend.
“The results of the consultation on CMI_2023 showed a sharp divide between insurer and reinsurer actuaries, who preferred a weight of 10% or less for 2022 and 2023 data, and pension consultants and other actuaries, who preferred higher weights for those years, typically 25% or more.
“Our chosen weight of 15% strikes a balance between these views and leads to a modest fall in life expectancies compared to CMI_2022. We encourage users our model to consider adjusting the model’s parameters to reflect their own portfolios and views on the impact of the pandemic.”
Chart A below shows standardised mortality rates (which allow for consistent comparisons of mortality over time) in the general population of England & Wales from 1983 to 2023.
There was a pronounced steady fall in mortality until 2011, but falls were more modest from 2011 to 2019. The increase in mortality from 2019 to 2020 was exceptional, with mortality in 2020 returning to levels of mortality last previously seen in 2008. Mortality fell between 2020 and 2023, returning to levels similar to 2016-2018 but higher than the relatively low mortality observed in 2019.
Chart A: Standardised mortality rates in England & Wales since 1983

Chart B below shows the progression of cohort life expectancy at age 65 in successive versions of the CMI Model. The figures for CMI_2023 are around 21 months lower than in the first version, CMI_2009.
Chart B: Cohort life expectancies as at 1 January 2024 at age 65 from CMI_2023 and earlier versions

For more information on the CMI Mortality Projections Model, CMI_2023, please see the FAQs.
The CMI Mortality Projections Committee produces mortality monitors with weekly summaries of emerging mortality and more detailed analyses quarterly.