22 June 2023
The Continuous Mortality Investigation (CMI) has released the latest annual update to the CMI Mortality Projections Model, CMI_2022.
Standardised mortality rates in England & Wales in 2022 were on average 3% lower than in 2021. However, mortality in 2020 to 2022 was significantly higher than before the coronavirus pandemic. Compared to mortality in 2019, mortality in 2020 was 14% higher, mortality in 2021 was 9% higher, and mortality in 2022 was 6% higher.
The CMI Model is used by UK pension schemes and insurance companies which need to make assumptions about future mortality rates. While mortality experience in 2020 and 2021 will affect actuarial calculations, mortality in both of those years was exceptional and is unlikely to be indicative of future mortality. For this reason, the CMI places no weight on the data for 2020 and 2021 in the core version of the model.
While mortality in 2022 has also been higher than pre-pandemic levels, it has been less volatile and may be indicative of future mortality to some extent. Given that, and following a consultation with users of the model, the CMI has placed 25% weight on data for 2022 when calibrating CMI_2022 while still placing no weight on data for 2020 and 2021.
CMI_2022 produces cohort life expectancies at age 65 that are about 7 months lower for males and about 6 months lower for females, than in the previous version of the CMI model, CMI_2021.
Cobus Daneel, Chair, CMI Mortality Projections Committee, said:
“Mortality rates can be volatile from year to year, but they tend to decrease over time. It is unusual to see three consecutive years where mortality rates are so much higher than the recent trend, even during prior pandemics such as the Asian Flu (1957/58) and the Hong Kong Flu (1968/69). We have to go back to World War II to find a period as unusual as 2020-2022 relative to the preceding five-year average.
“The exceptional nature of mortality in 2020 or 2021 due to the coronavirus pandemic meant that we placed no weight on mortality experience for those years. However, more recent data has been less volatile and suggests that mortality may remain higher than our expectations before the pandemic for some time. We have given partial weight to data for 2022 in the CMI Model, which leads to lower life expectancies.
“We made this change after a consultation process and received support from users in the pensions and insurance industry. However, we still encourage users to consider adjusting the model’s parameters to reflect their own portfolios and their views of the impact of the pandemic.”
The data used to calibrate CMI_2022 has been revised to reflect results of the 2021 census. We have used the ONS population estimates for 2021, which take account of the census, and we have revised our population estimates for 2012-2020, the period between the two most recent censuses, to be consistent with these. The ONS has not yet published its own revised estimates for 2012-2020. The revised population estimates for 2012-2021 account for around 1 month of the total 6-7 month fall in life expectancies at age 65 noted above.
Chart A shows standardised mortality rates (which allow for consistent comparisons of mortality over time) in the general population of England & Wales from 1981 to 2022. Standardised mortality rates nearly halved between 1981 and 2019, although the fall in mortality rates was modest between 2011 and 2019. Mortality was notably higher in 2020, 2021 and 2022 than in 2019, due to the coronavirus pandemic and its repercussions.
Chart A: Standardised mortality rates in England & Wales since 1982

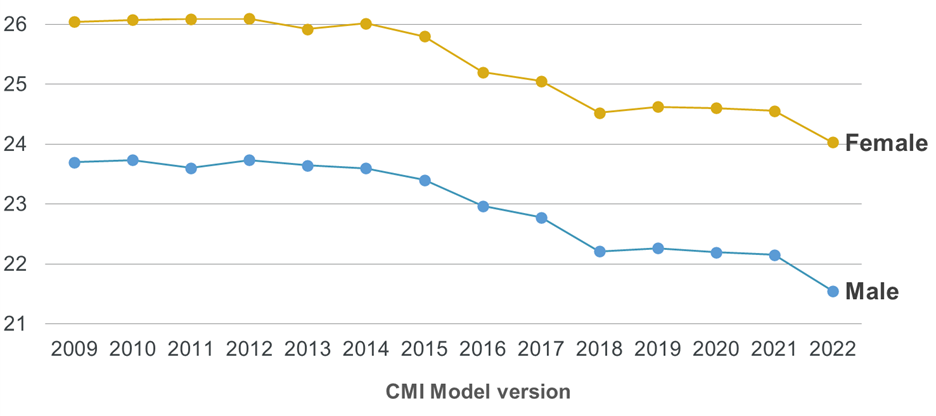
Chart B shows the progression of cohort life expectancy at age 65 in successive versions of the CMI Model. The figures for CMI_2022 are around two years lower than in the first version, CMI_2009.
Chart B: Cohort life expectancies as at 1 January 2023 at age 65 from CMI_2022 and earlier versions
For more information on the CMI Mortality Projections Model, CMI_2022, please see the FAQs.
From April 2020 to date, the CMI Mortality Projections Committee has produced a regular mortality monitor with a focus on ‘excess deaths’ during the pandemic.